

Introduction
In the fast-paced world of cryptocurrency trading, many investors find themselves navigating through a sea of information and strategies. With approximately 4.1 billion dollars lost to DeFi hacks in 2024, understanding reliable trading indicators like RSI (Relative Strength Index) and MACD (Moving Average Convergence Divergence) is crucial. This article aims to provide you with valuable insights and actionable tips for successfully using RSI and MACD indicators in your trading endeavors, especially within the Vietnamese crypto market.
Understanding RSI and MACD
Before diving into trading tips, it’s important to understand what these indicators are and how they function in the context of cryptocurrency.
- Relative Strength Index (RSI): A momentum oscillator that measures the speed and change of price movements, the RSI ranges from 0 to 100. Typically, readings above 70 indicate overbought conditions, while readings below 30 indicate oversold conditions.
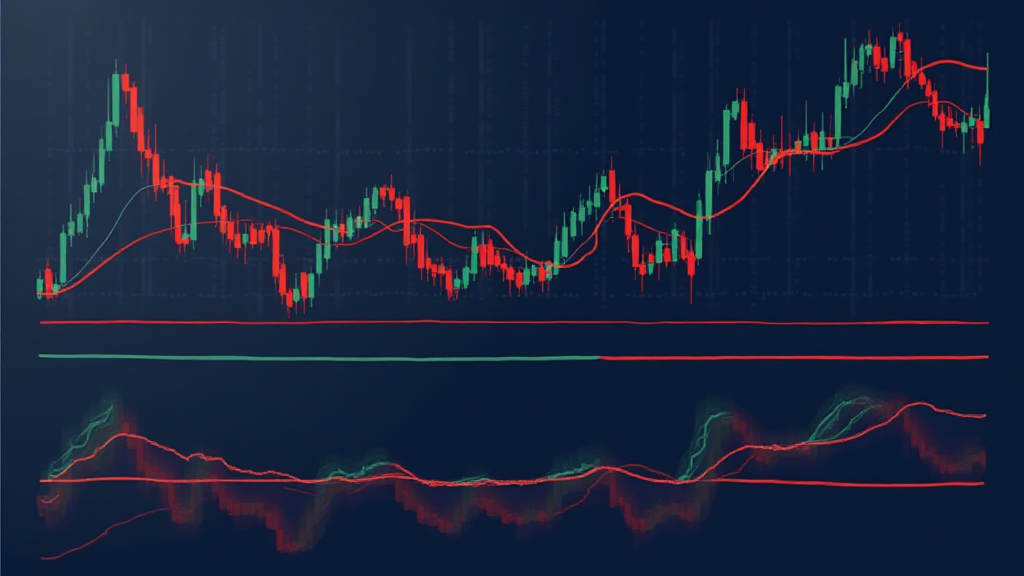
- Moving Average Convergence Divergence (MACD): This trend-following momentum indicator shows the relationship between two moving averages of a security’s price. The MACD is calculated by subtracting the 26-period EMA (Exponential Moving Average) from the 12-period EMA. It consists of the MACD line, the signal line, and the histogram, which helps traders identify potential buy/sell signals.
The Importance of Using RSI and MACD in Crypto Trading
For traders, these indicators can serve two primary functions:
- Identifying Trends: RSI can help you spot potential reversals in price trends, while MACD can confirm the strength of a trend.
- Timing Entries and Exits: Knowing when a cryptocurrency is overbought or oversold can guide your buy/sell decisions.
RSI: Tips and Strategies
When using RSI in your trading strategy, consider the following:
- Use Divergence: Look for divergences between price and RSI as this can signal potential reversals. For example, if the price is making new highs but the RSI is not, this could indicate a weakening bullish trend.
- Combine with Other Indicators: Don’t rely solely on RSI; use it in conjunction with other indicators such as MACD for improved accuracy.
- Be Mindful of Timeframes: RSI signals can differ across shorter and longer timeframes. A 14-period RSI on a daily chart may show different signals than on a weekly chart.
MACD: Tips and Strategies
Similarly, when applying MACD in your trading practices, keep these tips in mind:
- Watch for Crossovers: A bullish crossover occurs when the MACD line crosses above the signal line, suggesting upward momentum, while a bearish crossover indicates potential downward movement.
- Analyze the Histogram: The height of the histogram indicates the strength of the current trend. A growing histogram indicates an increasing trend, while a shrinking histogram may signify weakening momentum.
Combining RSI and MACD for Confirmed Signals
Combining both indicators effectively can enhance your trading strategy:
- Get Confirmed Entries: Use RSI to identify overbought/oversold conditions, then confirm your entry with MACD crossovers.
- Check for Trend Strength: When both indicators align (e.g., RSI is below 30, and the MACD line crosses above the signal line), it may indicate a robust buying opportunity.
Localized Insights: Crypto Trading in Vietnam
The Vietnamese crypto market has seen a significant change over the years, with the number of users increasing by approximately 150% in 2022. However, with this growth comes the need for reliable trading strategies.
As the Vietnamese market continues to evolve, resource platforms like hibt.com provide essential tools and guides to help traders optimize their strategies using RSI and MACD effectively.
Real-World Scenarios for Using RSI and MACD
Consider these scenarios to better understand how RSI and MACD work in actual trading:
- Scenario 1: A trader notices Bitcoin’s RSI is at 75. They could consider selling or shorting their position, especially if the MACD has already crossed below the signal line.
- Scenario 2: Ethereum might show an RSI of 25, alongside a MACD bullish crossover, indicating it could be an ideal time to buy.
Conclusion
Mastering the use of RSI and MACD indicators can dramatically improve your trading decisions in the crypto space. As you venture into trading, remember to incorporate these tools thoughtfully and stay updated on market trends. Additionally, always remember to consult with local regulators and financial advisors; this article does not constitute financial advice.
Whether you’re a seasoned trader or just starting, these tips can assist you in navigating the complexities of cryptocurrency investing. For more insights and resources on crypto trading, visit bitcoinformobile.
About the Author
Dr. Lam Nguyen is a leading blockchain consultant with over 25 published papers in the field. He has led audits for several notable projects in the crypto industry, focusing on secure and efficient smart contract implementations.

